
Introduction
Whenever an outage occurs and the incident handling process begins, the first responders and incident commander should be able to start their work as well-informed as possible. Having clarity about the situation is key to keeping in control of the incident from the get-go. Clarity enables good decision making.
A previous article detailed how to use Diagnostics-TK to define a list of re-usable diagnostic tests. In this article we will explore how to present these tests as questions and answers for everyone to understand.
Outputs
By default, Diagnostics-TK logs the results from each test it executes:
2023-05-07 12:09:39,690 - INFO - MyCompanyService::MyCompanyServiceTwitter(twitter-api)::test_hostname_resolvable - OK
2023-05-07 12:09:39,690 - INFO - MyCompanyService::MyCompanyServiceInstagram(instagram-api)::test_hostname_resolvable - OK
2023-05-07 12:09:39,706 - INFO - MyCompanyService::MyCompanyServiceInstagram(instagram-api)::test_host_up - OK
2023-05-07 12:09:40,512 - INFO - MyCompanyService::MyCompanyServiceTwitter(twitter-api)::test_host_up - OK
Whilst this might be informative for the people who wrote the tests it might not be for everybody else involved during or after the incident. How can we improve that?
Diagnostics-TK has the concept of outputs. An output is nothing more
than a class which accepts the results of each executed test for further
processing. An example of such a class is
ConsoleTable
which comes included by default. The ConsoleTable output displays the test
results in a table like structure.
We can extend the example of the previous article to include the ConsoleTable output as such:
#!/usr/bin/env python
# -*- coding: utf-8 -*-

from diagnostics_tk import DiagnosticsRunner
from diagnostics_tk.tools import exec_cli
from diagnostics_tk.output import ConsoleTable

class MyCompanyServiceSocialMedia:
    def __init__(self, hostname):
        self.hostname = hostname

    def test_host_up(self):
        """ """
        result, reason = exec_cli(
            f"nmap -sP {self.hostname}",
            exit_code=0,
            stdout_pattern="Host is up",
        )
        assert result, reason

    def test_hostname_resolvable(self):
        """ """
        result, reason = exec_cli(
            f"dig {self.hostname} @1.1.1.1",
            stdout_pattern="status: NOERROR",
            timeout=5,
        )
        assert result, reason


def main():
    with DiagnosticsRunner(name="my_infra", workers=5) as runner:
        runner.register(
            "twitter-api",
            MyCompanyServiceSocialMedia(hostname="api.twitter.com"),
        )
        runner.register(
            "instagram-api",
            MyCompanyServiceSocialMedia(hostname="api.instagram.com"),
        )
        runner.register(
            "facebook-api",
            MyCompanyServiceSocialMedia(hostname="api.facebook.com"),
        )

        runner.register("table", ConsoleTable(title="My Infra"))
The example shows we can register the ConsoleTable class instance just like
a test class1.
This yields following table overview:
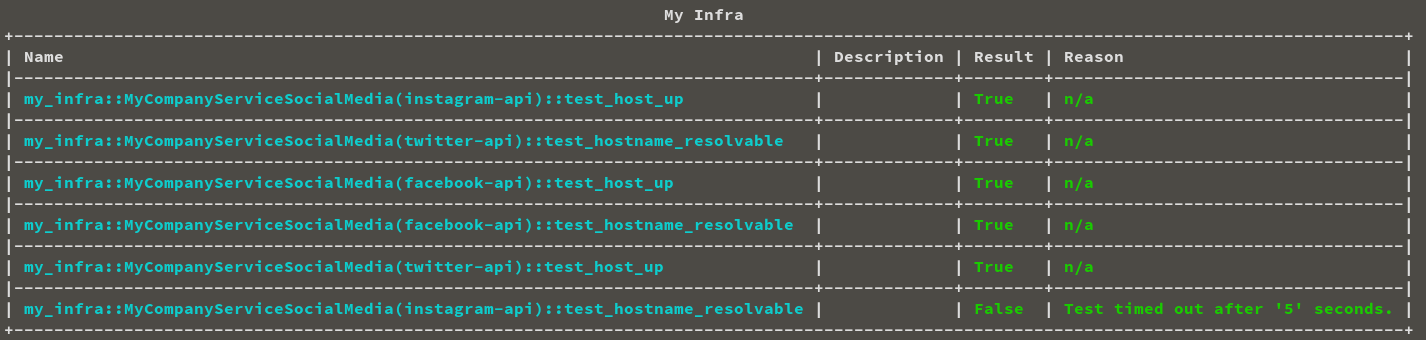
which is already a bit more pleasant to look at but not much more informative than before.
Docstrings
As seen in the above screenshot, the description for each entry is still
empty. We can provide content by defining a
docstring for each test_ method
respectively. The defined value is treated as a template using Python's
str.format()
which Diagnostic-TK attempts to render using any class
variables
it can find.
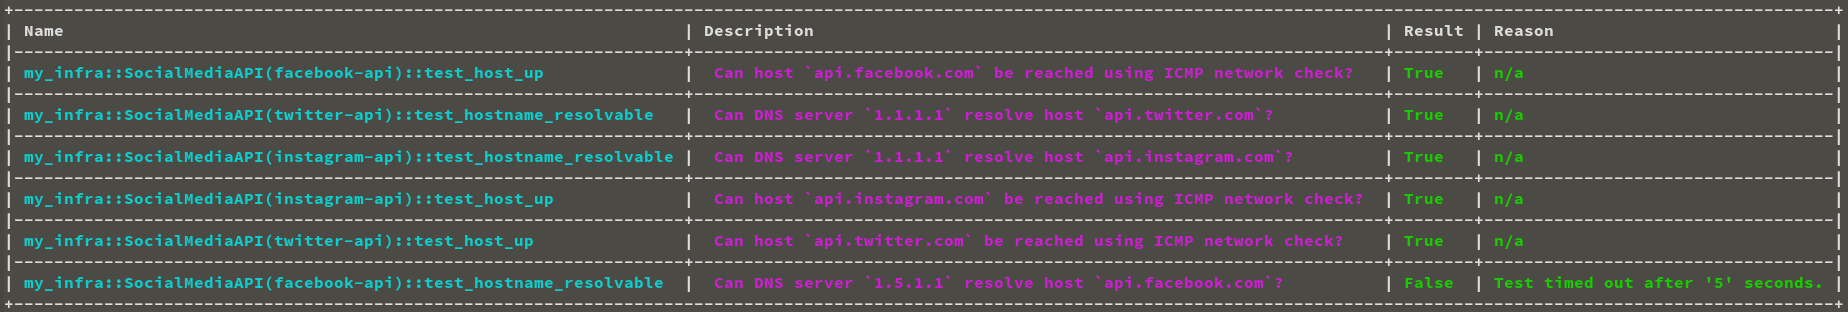
What style of description works best depends on the specific use-case and it is up to the reader to determine. However, when running diagnostic tests during an outage, we could write what we are testing in the form of a human readable question. Consider following updated example:
#!/usr/bin/env python
# -*- coding: utf-8 -*-

from diagnostics_tk import DiagnosticsRunner
from diagnostics_tk.output import ConsoleTable
from diagnostics_tk.tools import exec_cli


class SocialMediaAPI:
    def __init__(self, hostname, dns_server):
        self.hostname = hostname
        self.dns_server = dns_server

    def test_host_up(self):
        """
        Can host `{hostname}` be reached using an ICMP ping?
        """
        result, reason = exec_cli(
            f"nmap -sP {self.hostname}",
            exit_code=0,
            stdout_pattern="Host is up",
        )
        assert result, reason

    def test_hostname_resolvable(self):
        """
        Can DNS server `{dns_server}` resolve host `{hostname}`?
        """
        result, reason = exec_cli(
            f"dig {self.hostname} @{self.dns_server}",
            stdout_pattern="status: NOERROR",
            timeout=5,
        )
        assert result, reason


def main():
    with DiagnosticsRunner(name="my_infra", workers=5) as runner:
        runner.register(
            "twitter-api",
            SocialMediaAPI(hostname="api.twitter.com", dns_server="1.1.1.1"),
        )
        runner.register(
            "instagram-api",
            SocialMediaAPI(hostname="api.instagram.com", dns_server="1.1.1.1"),
        )
        runner.register(
            "facebook-api",
            SocialMediaAPI(hostname="api.facebook.com", dns_server="1.5.1.1"),
        )

        runner.register("table", ConsoleTable(title="My Infra"))


if __name__ == "__main__":
    main()
This yields following output:
Final Notes
In the A previous article we have motivated to start defining the diagnostic checks we execute manually during an incident as part of a Diagnostics-TK based setup. Turning manually executed, ad-hoc tests into a set of re-usable tests helps us to save time during incident. By encapsulating past incident experience in a programmatic way, we can build up a library of checks which validate the usual suspects which could cause or already have caused an outage.
The names of diagnostic checks could become quite cryptic and therefore are in need again for domain specific knowledge to understand their meaning and what they represent. In this article we have covered how Diagnostics-TK uses docstrings and how we can use those to our advantage by presenting a validation as a question and answer for everyone to understand involved during and after the incident.
Keep in mind that the above examples, although useful, are simple in nature and are already easy to understand for for many familiar with the topic. The sort of checks which are required to validate all the things required for your service to run, pass into the realm of the cryptic pretty quickly.
In a next article of the Diagnostics-TK series we
will focus how to create an output class and send the check results to
Slack.
If you have any feedback or suggestions, don't hesitate to get in touch on Twitter.