This article is superseded
Read Submit Nagios metrics to Graphite with ModGearman and MetricFactory revisited instead.
When it comes down to monitoring Nagios is still the weapon of choice for many. I would have abandoned it if there weren't projects like Livestatus, Mod_Gearman and Thruk which to my opinion should never be missing from any Nagios setup. Mod_Gearman, the framework which makes Nagios scalable, has a feature which stores the performance data produced by the Nagios plugins into a Gearman queue. Graphing that performance data with Graphite is a straightforward job with Metricfactory.
Performance data
Mod_Gearman is a Nagios addon which spreads the Nagios plugin execution over a farm of worker nodes. This allows you to build a scalable Nagios setup quite effectively. The workers execute the Nagios plugins and submit the produced results back into the Gearman master server. A Nagios broker module then consumes the submitted check results from the Gearman master and submits the check results into Nagios for further processing. The broker module can optionally submit the performance data back into a dedicated Gearman queue ready to be consumed by an external process which in our case is going to be Metricfactory. Metricfactory will convert the performance data into the proper format and submit that into Graphite.
Mod_Gearman
The Mod_Gearman project has quite extensive documentation available but these are the relevant parameters:
perfdata=yes
Setting the value to yes makes the broker module write the performance data to the perfdata queue.
perfdata_mode=1
Setting the value to 1 makes sure that performance data doesn't pile up endlessly in the queue when Metricfactory isn't consuming. It's basically a precaution which prevents the queue to fill up to a point all available system memory is consumed. Setting the value to 2 will append all performance data to the queue without overwriting old data. When enabled you can execute the gearman_top command and you should see the perfdata queue appear:
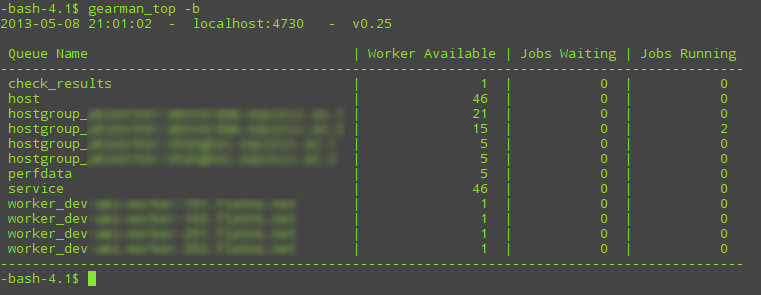
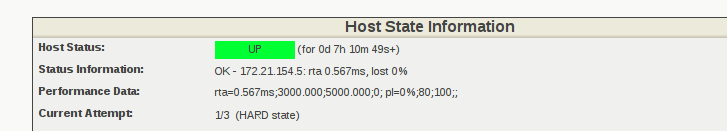
The Jobs Waiting column indicates how many performance data is currently stored in the queue. Ideally this should be 0 or as low as possible and never grow otherwise that might indicate the performance data is not consumed fast enough. Keep in mind that not all Nagios plugins produce performance data. If you want to be sure whether a plugin produces performance data, have a look in Thruk (or other Nagios interface) and verify in the service or host details whether Performance Data actually contains valid perfdata.
Metricfactory
You can download Metricfactory from Github and get it up an running quite easily by following the installation instructions. In our case, you will require some additional modules which you can install from Pypi using the easy_install command:
$ easy_install wb_gearmand
$ easy_install wb_tcpclient
$ easy_install wb_tippingbucket
$ easy_install wb_stdout
When all went well you should be able to execute (ascii.io screencast):
$ metricfactory list
Configuration
Metricfactory uses bootstrap files which define the modules to load and how events will flow through the chain. You can download a base example here.
{
  "metrics": {
    "enable": true,
    "group": "wishbone.metrics",
    "interval": 10,
    "module": "Log",
    "variables": {
    }
  },
  "bootstrap": {
    "modgearman": {
      "group": "wishbone.iomodule",
      "module": "Gearmand",
      "variables": {
        "hostnames": [ "your.gearmand.server.hostname" ],
        "secret": "changemechangeme",
        "workers": 1
      }
    },
    "decodemodgearman": {
      "group": "metricfactory.decoder",
      "module": "ModGearman",
      "variables": {
      }
    },
    "encodegraphite": {
      "group": "metricfactory.encoder",
      "module": "Graphite",
      "variables": {
        "prefix":"nagios"
      }
    },
    "buffer": {
      "group": "wishbone.module",
      "module": "TippingBucket",
      "variables": {
        "events": 1000,
        "age": 60
      }
    },
    "tcpout": {
      "group": "wishbone.iomodule",
      "module": "TCPClient",
      "variables": {
        "pool": ["your.graphite.relay1:2013","your.graphite.relay2:2013"]
      }
    },
    "stdout": {
      "group": "wishbone.module",
      "module": "STDOUT",
      "variables": {
        "purge":true
      }
    }
  },
  "routingtable": {
    "modgearman.inbox": [ "decodemodgearman.inbox" ],
    "decodemodgearman.outbox": [ "encodegraphite.inbox" ],
    "encodegraphite.outbox": [ "tcpout.inbox" ]
  }
}
Depending on your environment you will have to adapt some of the variables in the boostrap file. The hostnames variable (line 15) is a list of the Gearmand servers from which the perfdata has to be consumed. Usually this is a list containing just 1 server. In some special cases you might add more servers here but that's in our case not likely.
The secret variable (line 16) should contain the pre-shared encryption key allowing you to decrypt the information consumed from Gearmand. Worth to mention there is no authentication, but without the decryption key you wont be able to read the data coming from the Gearmand server.
The number of workers variable (line 17) determines how many workers should consume perfdata from the perfdata queue. If you notice perdata isn't consumed fast enough, you could bump this number to a higher value. In this case keep an eye on the the CPU usage of Metricfactory due to the decrypting. If you notice Metricfactory can't keep up because of high cpu usage then another strategy might be to leave this number on 1 and start Metricfactory with the --instances x parameter, where x is the number of parallel processes.
In this configuration, the buffer instance of the TippingBucket module will flush when 1000 metrics (line 27) are in the buffer or when the last metric added to the buffer is 60 seconds (line 38) old. This allows you to control the size of the data per outgoing connection to Graphite. It's more efficient to group and submit metrics instead of making a connection to Graphite per metric.
The tcpout instance is initiated in this example with the addresses of 2 Graphite relay servers (line 45). When defining more than 1 address in the pool list then the client will randomly select one of the addresses until a successful connect is done. To test, you can start Metricfactory in debug mode to keep it from forking in the background and by enabling the --loglevel debug parameter:
$ metricfactory debug --config modgearmand2graphite.json --loglevel debug
Converting Nagios format to graphite format
Graphite stores the metrics in a tree-like hierarchical manner using a dotted naming scheme. Somehow we will have to convert the Nagios metrics into this format. Metricfactory converts the metrics coming from an external source into a common Metricfactory format. From this format it's straightforward to convert them into another format. Unfortunately, many years of Nagios plugin development has lead to all kinds of metric name formats. This inconsistency is something we will have to deal with. Consider following examples:
rta=1.274ms;3000.000;5000.000;0; pl=0%;80;100;;
/=1351MB;3426;3627;0;4031 /dev=0MB;3046;3225;0;3584 /dev/shm=0MB;3054;3233;0;3593 /boot=26MB;205;217;0;242 /tmp=16MB;427;452;0;503 /var=1430MB;6853;7256;0;8063 /var/tmp=16MB;427;452;0;503
MemUsedPercent=7%;98;102;0;100 SwapUsedPercent=0%;80;90;0;100 MemUsed=486MB;;;0;7187 SwapUsed=0MB;;;0;204
The names of metrics in the first example are rta and pl respectively. In the second example the metric names are the paths of mount points containing slashes. The 3rd example has metric names with mixed uppercase and lowercase. Although the decode.gearman module does some basic metric name sanitation, it's perfectly possible to write a Wishbone module and plug it into your MetricFactory chain to convert the metric names into whatever your like but covering that topic is out of scope of this article. To get an idea how our data looks like after each module we're going to alter the routing table in the bootstrap file accordingly. If you take look at our bootstrap file, you notice we have an additional module initiated called stdout (line 48) which is not included in our routing table. The stdout module prints, as you might guess, incoming events to STDOUT. Let's go over each step to see how our data looks like:
Data coming from wishbone.iomodule.Gearmand
To print the data coming from Mod_Gearman to STDOUT we change our routing table to the following:
"routingtable": {
    "modgearman.inbox": [ "stdout.inbox" ]
  }
Start Metricfactory in the foreground (ascii.io screencast):
$ metricfactory debug --config modgearmand2graphite.json --loglevel debug
Example host performance data:
DATATYPE::HOSTPERFDATA TIMET::1368178733 HOSTNAME::host_339 HOSTPERFDATA::rta=0.091ms;3000.000;5000.000;0; pl=0%;80;100;; HOSTCHECKCOMMAND::check:host.alive!(null) HOSTSTATE::0 HOSTSTATETYPE::1
Example service performance data:
DATATYPE::SERVICEPERFDATA TIMET::1368178797 HOSTNAME::localhost SERVICEDESC::Gearman Queues SERVICEPERFDATA::'check_results_waiting'=0;10;100;0 'check_results_running'=0 'check_results_worker'=1;25;50;0 'host_waiting'=0;10;100;0 'host_running'=0 'host_worker'=10;25;50;0 'hostgroup_localhost_waiting'=0;10;100;0 'hostgroup_localhost_running'=1 'hostgroup_localhost_worker'=10;25;50;0 'perfdata_waiting'=0;10;100;0 'perfdata_running'=0 'perfdata_worker'=1;25;50;0 'service_waiting'=0;10;100;0 'service_running'=0 'service_worker'=10;25;50;0 'worker_nagios-001_waiting'=0;10;100;0 'worker_nagios-001_running'=0 'worker_nagios-001_worker'=1;25;50;0 SERVICECHECKCOMMAND::check:app.gearman.master SERVICESTATE::0 SERVICESTATETYPE::1
Data coming from metricfactory.decoder.ModGearman
So the data coming from Mod_Gearman needs to be converted into the common Metricfactory internal format. For this we use a module from the metricfactory.decoder group, in this case ModGearman.
Change the routing table to following configuration:
"routingtable": {
    "modgearman.inbox": [ "decodemodgearman.inbox" ],
    "decodemodgearman.outbox": [ "stdout.inbox" ]
}
Start Metricfactory in the foreground (ascii.io screencast):
$ metricfactory debug --config modgearmand2graphite.json --loglevel debug
Example host perfdata:
{'name': 'rta', 'tags': ['check:host_alive!(null)', 'hostcheck'], 'value': '0.155', 'source': 'host_409', 'time': '1368179085', 'units': 'ms', 'type': 'nagios'}
Example service perfdata:
{'name': 'perfdata_waiting', 'tags': ['check:app_gearman_master', 'gearman_queues'], 'value': '0', 'source': 'localhost', 'time': '1368179129', 'units': '', 'type': 'nagios'}
The ModGearman decoder module filters out some characters from different parts
Data coming from metricfactory.encoder.Graphite
Now we have to convert the metrics from the internal Metricfactory format into a the Graphite format. The encodegraphite module has a parameter prefix (line 30) which allows you to define a prefix for the name of each metric to store in Graphite. With this configuration, each metric will start with "nagios.".
Change the routing table to following configuration:
"routingtable": {
    "modgearman.inbox": [ "decodemodgearman.inbox" ],
    "decodemodgearman.outbox": [ "encodegraphite.inbox" ],
    "encodegraphite.outbox": [ "stdout.inbox" ]
  }
Start Metricfactory in the foreground (ascii.io screencast):
$ metricfactory debug --config modgearmand2graphite.json --loglevel debug
Example:
nagios.host_260.hostcheck.pl 0 1368179289
nagios.host_26.hostcheck.rta 0.133 1368179289
nagios.host_26.hostcheck.pl 0 1368179289
nagios.host_256.hostcheck.rta 0.123 1368179289
nagios.localhost.gearman_queues.service_running 0 1368179329
nagios.localhost.gearman_queues.service_worker 9 1368179329
nagios.localhost.gearman_queues.worker_nagios-001_waiting 0 1368179329
nagios.localhost.gearman_queues.worker_nagios-001_running 0 1368179329
nagios.localhost.gearman_queues.worker_nagios-001_worker 1 136817932
As you can see the Graphite encoder module had to make some assumptions. In case the metric type is Nagios (the internal format contains this information) then the hostchecks always have the word hostcheck in the metric name as you can see in the above example. When the data is a Nagios servicecheck, then the service description is included in the metric name.
Graphite
Typically Nagios schedules checks every 5 minutes. This doesn't really result in high resolution metrics and is often used as a point of critique. Keep this in mind when you define a Graphite retention policy. In the example configuration we use nagios as a prefix (line 30), so you could use a Whisper retention policy similar to:
[nagios]
priority = 100
pattern = ^nagios\.
retentions = 300:2016
Make sure the Nagios execution interval corresponds properly to the retentions parameter to prevent gaps.
Conclusion
We have covered how to setup Metricfactory to consume metric data from ModGearman and submit that to Graphite. We covered in detail how data changes when traveling through the different modules to get a better understanding of the whole process.