When it comes down to monitoring Nagios is still the weapon of choice for many. I would have abandoned it if there weren't projects like Livestatus, Mod_Gearman and Thruk which to my opinion should never be missing from any Nagios setup. Mod_Gearman, the framework which makes Nagios scalable, has a feature which stores the performance data produced by the Nagios plugins into a Gearman queue. Graphing that performance data with Graphite is a straightforward job with Metricfactory.
Performance data
Mod_Gearman is a Nagios addon which spreads the Nagios plugin execution over a farm of worker nodes. This allows you to build a scalable Nagios setup quite effectively. The workers execute the Nagios plugins and submit the produced results back into the Gearman master server. A Nagios broker module then consumes the submitted check results from the Gearman master and submits the check results into Nagios for further processing. The broker module can optionally submit the performance data back into a dedicated Gearman queue ready to be consumed by an external process which in our case is going to be Metricfactory. Metricfactory will convert the performance data into the proper format and submit that into Graphite.
Mod_Gearman
The Mod_Gearman project has quite extensive documentation available but these are the relevant parameters:
perfdata=yes
Setting the value to yes makes the broker module write the performance data to the perfdata queue.
perfdata_mode=1
Setting the value to 1 makes sure that performance data doesn't pile up endlessly in the queue when Metricfactory isn't consuming. It's basically a precaution which prevents the queue to fill up to a point all available system memory is consumed. Setting the value to 2 will append all performance data to the queue without overwriting old data. When enabled you can execute the gearman_top command and you should see the perfdata queue appear:
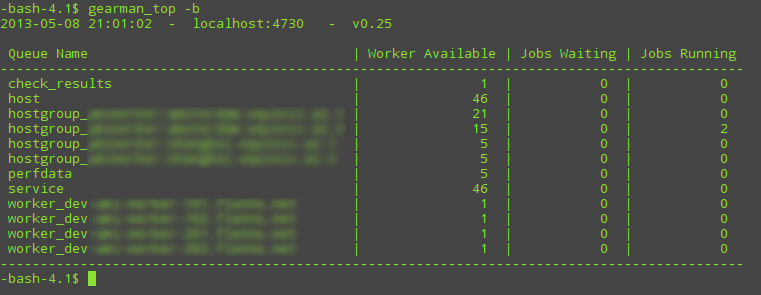
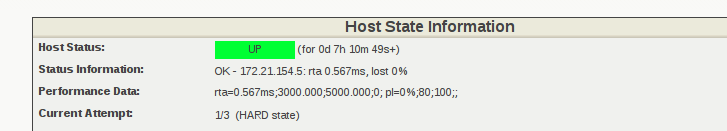
The Jobs Waiting column indicates how many performance data is currently stored in the queue. Ideally this should be 0 or as low as possible and never grow otherwise that might indicate the performance data is not consumed fast enough. Keep in mind that not all Nagios plugins produce performance data. If you want to be sure whether a plugin produces performance data, have a look in Thruk (or other Nagios interface) and verify in the service or host details whether Performance Data actually contains valid perfdata.
Metricfactory
Installation
You can install Metricfactory and its dependencies from Pypi using easy_install:
$ easy_install metricfactory
Quick introduction
Metricfactory makes use of Wishbone to build an pipeline of modules through which events travel and change. The setup of the Metricfactory server is described in a bootstrapfile. A bootstrap file contains which modules to initialize and which path data has to follow throughout these modules.
The idea behind a MetricFactory server is that it accepts metrics, converts them into a common format, which on its turn can be processed and/or converted again into another format.
We will gradually build up our solution by going through each step.
Consume perfdata
First let's have a look how the perfdata looks like when consuming it without modifications:
---
modules:
    gearmand:
        module: wishbone.input.gearman
        arguments:
            hostlist:
                - server-001
            secret: changemechangeme
            queue: perfdata
            workers: 5

    decode:
        module: metricfactory.decode.modgearman

    encode:
        module: wishbone.encode.graphite
        arguments:
            prefix: nagios.
            script: false

    stdout:
        module: wishbone.output.stdout

routingtable:

    - gearmand.outbox   -> stdout.inbox
    # - decode.outbox     -> encode.inbox
    # - encode.outbox     -> stdout.inbox
...
Depending on your environment you will have to adapt some of the variables in the boostrap file. The hostlist variable (line 6) is a list of the Gearmand servers from which the perfdata has to be consumed. Usually this is a list containing just 1 server. In some special cases you might add more servers here but that's in our case not likely.
The secret variable (line 8) should contain the pre-shared encryption key allowing you to decrypt the information consumed from Gearmand. Worth to mention there is no authentication, but without the decryption key you wont be able to read the data coming from the Gearmand server.
The number of workers variable (line 10) determines how many workers should consume the perfdata queue. If you notice perfdata isn't consumed fast enough, you could bump this number to a higher value. In this case keep an eye on the the CPU usage of Metricfactory due to the decrypting. If you notice Metricfactory can't keep up because of high CPU usage then another strategy might be to leave this number on 1 and start Metricfactory with the --instances x parameter, where x is the number of parallel processes.
In this example we have connected the gearmand.output queue to the stdout.inbox (line 26). As a result, the perfdata will flow from the gearmand module directly to the stdout module.
Start metricfactory in the foreground and verify whether you get the expected output:
$ metricfactory debug --config modgearmand2graphite.yaml
DATATYPE::HOSTPERFDATA  TIMET::1383777750 HOSTNAME::aaaaaaaaaaaaa HOSTPERFDATA::rta=15.589ms;3000.000;5000.000;0; pl=0%;80;100;;  HOSTCHECKCOMMAND::check:host.alive!(null) HOSTSTATE::0  HOSTSTATETYPE::1
DATATYPE::HOSTPERFDATA  TIMET::1383777750 HOSTNAME::bbbbbbbbbbbbb HOSTPERFDATA::rta=16.776ms;3000.000;5000.000;0; pl=0%;80;100;;  HOSTCHECKCOMMAND::check:host.alive!(null) HOSTSTATE::0  HOSTSTATETYPE::1
DATATYPE::HOSTPERFDATA  TIMET::1383777750 HOSTNAME::ccccccccccccc HOSTPERFDATA::rta=16.559ms;3000.000;5000.000;0; pl=0%;80;100;;  HOSTCHECKCOMMAND::check:host.alive!(null) HOSTSTATE::0  HOSTSTATETYPE::1
DATATYPE::HOSTPERFDATA  TIMET::1383777750 HOSTNAME::ddddddddddddd HOSTPERFDATA::rta=16.381ms;3000.000;5000.000;0; pl=0%;80;100;;  HOSTCHECKCOMMAND::check:host.alive!(null) HOSTSTATE::0  HOSTSTATETYPE::1
...snip...
Decode Nagios format into generic format
The next step is to decode the perfdata into a common format.
---
modules:
    gearmand:
        module: wishbone.input.gearman
        arguments:
            hostlist:
                - server-001
            secret: changemechangeme
            queue: perfdata
            workers: 5

    decode:
        module: metricfactory.decode.modgearman

    encode:
        module: wishbone.encode.graphite
        arguments:
            prefix: nagios.
            script: false

    stdout:
        module: wishbone.output.stdout

routingtable:

    - gearmand.outbox   -> decode.inbox
    - decode.outbox     -> stdout.inbox
    # - encode.outbox     -> stdout.inbox
...
We have already defined the correct modules, so it's only a matter of changing the data flow (line 26, 27).
$ metricfactory debug --config modgearmand2graphite.yaml
('1383778474', 'nagios', 'aaaaaaaaaaaaa', 'hostcheck.rta', '0.000', 'ms', ('check:host.alive', 'hostcheck'))
('1383778474', 'nagios', 'bbbbbbbbbbbbb', 'hostcheck.pl', '100', '%', ('check:host.alive', 'hostcheck'))
...snip...
Encode generic format to Graphite format
The next step is to convert the generic format into Graphite format. That what the wishbone.builtin.metrics.graphite module does, which is in our example initiated with name encode. The is a builtin module because Wishbone can export its internal metrics to Graphite.
---
modules:
    gearmand:
        module: wishbone.input.gearman
        arguments:
            hostlist:
                - server-001
            secret: changemechangeme
            queue: perfdata
            workers: 5

    decode:
        module: metricfactory.decode.modgearman

    encode:
        module: wishbone.encode.graphite
        arguments:
            prefix: nagios.
            script: false

    stdout:
        module: wishbone.output.stdout

routingtable:

    - gearmand.outbox   -> decode.inbox
    - decode.outbox     -> encode.inbox
    - encode.outbox     -> stdout.inbox
...
We can activate this step by altering the routing table appropriately (line 27, 28).
Running metricfactory with this bootstrap file gives us following results: (hostnames have been obfuscated)
$ metricfactory debug --config modgearmand2graphite.yaml
nagios.aaaaaaaaaaaaaaa.hostcheck.pl 100 1383859655
nagios.bbbbbbbbbbbbbbb.hostcheck.rta 0.000 1383859655
nagios.ccccccccccccccc.hostcheck.pl 100 1383859655
nagios.ddddddddddddddd.hostcheck.rta 128.370 1383859663
nagios.eeeeeeeeeeeeeee.hostcheck.pl 0 1383859663
nagios.fffffffffffffff.hostcheck.rta 213.073 1383859663
nagios.ggggggggggggggg.memory_and_swap_usage.memusedpercent 16 1383859695
nagios.hhhhhhhhhhhhhhh.memory_and_swap_usage.swapusedpercent 0 1383859695
nagios.iiiiiiiiiiiiiii.memory_and_swap_usage.memused 1178 1383859695
nagios.jjjjjjjjjjjjjjj.memory_and_swap_usage.swapused 0 1383859695
...snip...
Write to Graphite
Writing metrics to STDOUT is nice to see how results look like but that's not what we want. The next step is to write the Graphite metrics into Graphite. For this we require the wishbone.output.tcp module which we initiate with name tcpout in the following bootstrap file:
---
modules:
    gearmand:
        module: wishbone.input.gearman
        arguments:
            hostlist:
                - server-001
            secret: changemechangeme
            queue: perfdata
            workers: 5

    decode:
        module: metricfactory.decode.modgearman

    encode:
        module: wishbone.encode.graphite
        arguments:
            prefix: nagios.
            script: false

    stdout:
        module: wishbone.output.stdout

    tcpout:
        module: wishbone.output.tcp
        arguments:
            host: graphite-001
            port: 2013

routingtable:

    - gearmand.outbox   -> decode.inbox
    - decode.outbox     -> encode.inbox
    - encode.outbox     -> tcpout.inbox
...
You can leave the stdout module in here for convenience. As long it doesn't occur in the routingtable definition it doesn't serve a purpose.
Conclusion
We have covered how to setup Metricfactory to consume metric data from ModGearman and submit that to Graphite. We covered in detail how data changes when traveling through the different modules to get a better understanding of the whole process.
| [1] | This article has been updated |