In this post we revisit a previously posted article on how we can test and stress test a Graphite setup. This is basically a rewrite of that article since the Wishbone and MetricFactory software have meanwhile changed enough to dedicate a new article to it.
Our end-goal still stands. We want to test and understand the behavior of a Graphite setup by writing metrics into it using different scenarios.
Installation
Installing metricfactory is a matter of checking out the project from Git and running the installer. All dependencies should be downloaded automatically.
$ git clone https://github.com/smetj/metricfactory
$ cd metricfactory
$ sudo python setup.py install
An additional Wishbone module:
$ git clone https://github.com/smetj/wishboneModules
$ cd wishboneModules/wb_output_tcp/
$ sudo python setup.py install
One or more of following packages might be required to successfully finish the install:
gcc, gcc-c++, make, python-devel, Cython
Once installed you can execute following command:
$ metricfactory list
$ metricfactory list --group metricfactory.encoder
$ metricfactory list --group metricfactory.decoder
$ metricfactory list --group metricfactory.test
That should return a list of all available modules. You should see at least tcp, hammer and graphite.
Bootstrap
Starting Metricfactory requires a bootstrap file. A bootstrap file is a YAML formatted file containing the configuration of which modules to initiate and which path events will follow through these module instances.
All bootstrap files used throughout this article can be found here.
Scenario 1: Submit fixed number of metrics to graphite.
Let's say we have a Graphite setup of 1 carbon-relay instance which forwards metrics to 1 or more carbon instances. We want to see how Graphite behaves under a predictable load.
---
modules:

    hammer:
        module: metricfactory.test.hammer
        arguments:
            batch: 1
            batch_size: 100
            set_size: 100
            value: 1000

    encodegraphite:
        module: wishbone.builtin.metrics.graphite

    tcp:
        module: wishbone.output.tcp
        arguments:
            host: graphite-001
            port: 2013

routingtable:

    - hammer.outbox             -> encodegraphite.inbox
    - encodegraphite.outbox     -> tcp.inbox
...
The hammer module (line 4) is the module which generates metrics in a generic format. The module is initialized to produce 1 batch (line 7) of metrics consisting out of 100 unique sets (line 8) each containing 100 metrics (line9). This means 10000 unique metrics are generated. Batch (line 7) determines how many times we want to regenerate this collection of metrics. A value of 0 would mean indefinitely. The sleep parameter (not used, default 1) determines the time in seconds between each batch. The value parameter (line 10) determines the maximum value the random generated metric value can be.
The routing table (line 21) tells us events are traveling through the modules in following order:
hammer -> encodegraphite -> tcp
The tcp module (line 15) submits the metrics over TCP to the destination defined with the host (line 18) and port (line 19)
Start the server in the foreground using following command:
$ metricfactory debug --config hammer_scenario_1.yaml
You can stop by pressing ctrl+c.
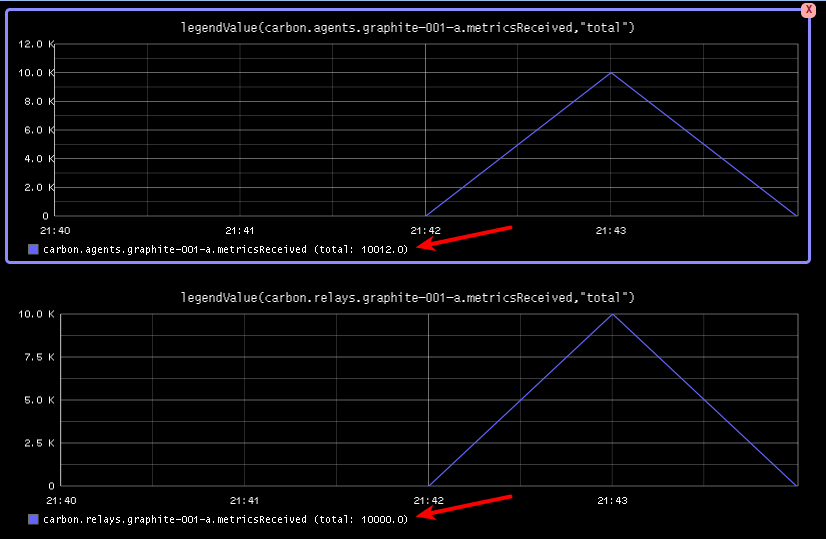
When reviewing the metricsReceived values of both the carbon.relay as carbon.cache we see we have received the expected amount of metrics.
Keep in mind since each generated metric is unique, 10000 wsp files are created. It's likely that after running this test, you will only find a subset of the generated data stored in Graphite. This is because Graphite does rate limiting and is not creating all wsp files in order not to hammer the disks. You might want to tweak Graphite to meet your expectations and rerun the above setup to test your setup.
Scenario 2: Submit a fixed number of metrics to 2 carbon-relays
Let's say we have a setup with 2 carbon relays with multiple carbon-caches behind that. In this case you might want to verify whether you can really afford to loose a relay node. We can use the same approach as we did in scenario 1 and produce and submit a known number of metrics.
The below bootstrap file is setup in such a way that produced metrics are spread over 2 tcp destinations. You might want to execute a couple of runs while killing parts of your Graphite setup to verify it behaves as expected and whether there is no metric loss.
---
modules:

    hammer:
        module: metricfactory.test.hammer
        arguments:
            batch: 10
            batch_size: 100
            set_size: 100
            value: 1000
            sleep: 1

    encodegraphite:
        module: wishbone.builtin.metrics.graphite

    funnel:
        module: wishbone.builtin.flow.funnel

    balance:
        module: wishbone.builtin.flow.roundrobin

    tcp1:
        module: wishbone.output.tcp
        arguments:
            host: graphite-001
            port: 2013

    tcp2:
        module: wishbone.output.tcp
        arguments:
            host: graphite-002
            port: 2013

routingtable:

    - hammer.outbox             -> encodegraphite.inbox
    - encodegraphite.outbox     -> funnel.two

    - funnel.outbox             -> balance.inbox
    - balance.one               -> tcp1.inbox
    - balance.two               -> tcp2.inbox

    - tcp1.failed               -> funnel.one
    - tcp2.failed               -> funnel.three
...
Start the server in the foreground using following command:
$ metricfactory debug --config hammer_scenario_2.yaml
You can stop by pressing ctrl+c.
The above example will send 10 batches (line 7) of 100 sets (line 8) of 100 metrics (line 9) resulting into 100000 unique metrics. Between each batch 10000 metrics we wait 1 second (line 11).
Scenario 3: Determine the maximum throughput of metrics
Let's say we want to have a ballpark number of how many metrics per second our Graphite instance is able to receive.
For this we use the below bootstrap file:
---
modules:

    hammer:
        module: metricfactory.test.hammer
        arguments:
            batch: 0
            batch_size: 100
            set_size: 100
            value: 1000

    encodegraphite:
        module: wishbone.builtin.metrics.graphite

    tcp:
        module: wishbone.output.tcp
        arguments:
            host: graphite-001
            port: 2013

routingtable:

    - hammer.outbox             -> encodegraphite.inbox
    - encodegraphite.outbox     -> tcp.inbox
...
By setting the batch argument (line 10) to 0, we indefinitely send the defined batch. If we overflow Metricfactory because we can't write metrics out fast enough , throttling will be enabled automatically.
You could even start X amount of similar parallel processes by using the --instances parameter when bootstrapping:
$ metricfactory debug --config hammer_scenario_3.yaml --instances 4
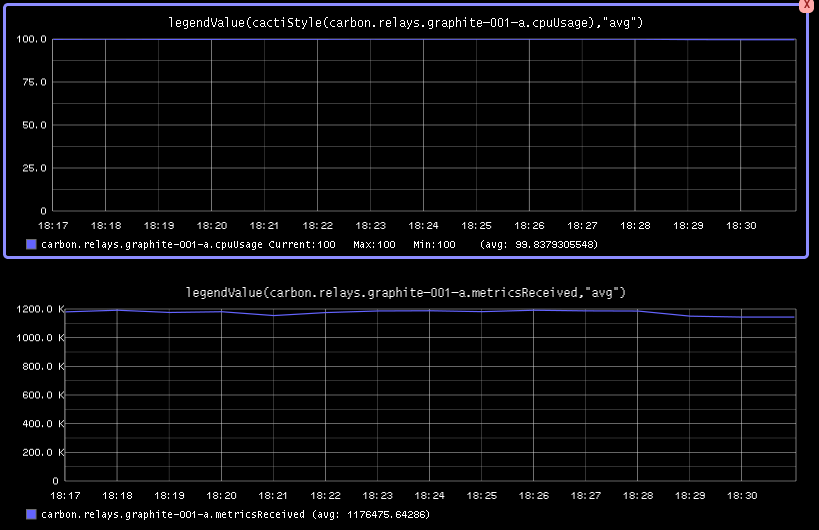
As you can see we're maxing out the cpu usage of the relay server while processing on average 1117000 metrics/s.
Conclusion
Generating a predictable number of metrics can be practical to verify whether Graphite behaves as expected in different scenarios. It becomes even more meaningful when you have a more complex environment with a number of relays with sharding and duplication policies. By generating batches of continuous metrics it's possible to get an idea about the throughput of your Graphite setup.