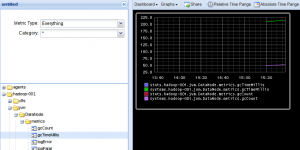
Without metrics we're flying blind and that's very much the case with Hadoop. Hadoop is a well known framework to build reliable, scalable and distributed computing clusters. The Hadoop framework is a complex environment which "out of the box" hardly offers any metrics oversight on how the different components are performing.
Graphite is king of the hill when it comes to graphing metrics with open source. Hadoop doesn't support Graphite's data format and way to submit metrics, however it does natively support the Ganglia graphing framework. That is something we are going to use to our advantage.
MetricFactory is a modular tool which allows you to build servers which can do "stuff" with metrics. In this case "stuff" means accepting Ganglia metrics, convert and submit them to the Graphite framework.
The information this blog post is just another way of doing things which might suit your needs better than any other available options.
Hadoop metrics
As we already mentioned Hadoop can generate Ganglia formatted metrics. Hadoop metrics are controlled by /etc/hadoop/conf/hadoop-metrics.properties
You should have at least following entries:
dfs.class=org.apache.hadoop.metrics.ganglia.GangliaContext31
dfs.period=10
dfs.servers=metricfactory-001
mapred.class=org.apache.hadoop.metrics.ganglia.GangliaContext31
mapred.period=10
mapred.servers=metricfactory-001
jvm.class=org.apache.hadoop.metrics.ganglia.GangliaContext31
jvm.period=10
jvm.servers=metricfactory-001
rpc.class=org.apache.hadoop.metrics.ganglia.GangliaContext31
rpc.period=10
rpc.servers=metricfactory-001
The rpc.period defines the interval to submit metrics. In this case 10 seconds.
Graphite
The Graphite instance does nothing particular. You can consult the graphs by visiting following URL: http://http://graphite-001/dashboard/
MetricFactory
MetricFactory's setup is controlled through so called bootstrap files. These files contain the information on which modules need to be loaded, how they are initiated and how they are connected to each other.
For this scenario we need to have at least:
- UDP input (The Ganglia metrics come in over UDP).
- Ganglia decoder (Deserialize the XDR format into a generic format.)
- Graphite encoder (Convert the generic format into a Graphite format.)
- A TCP client (Write the metrics into Graphite)
A small test
First let's make a small test using this bootstrapfile. Instead of writing the converted data to Graphite, we're going to print it to STDOUT. Not very useful, although this way we can verify clearly whether we have data coming in and whether the output format is as we expect.
We can start MetricFactory with the debug option so it does not detach into the background. CTRL-C stops the process again:
[vagrant@metricfactory-001 ~]$ metricfactory debug --config /home/vagrant/experiments/metricfactory/ganglia2graphite/ganglia2graphite2stdout.json
2013-01-07 22:38:06,150 INFO root: Starting MetricFactory in foreground.
2013-01-07 22:38:06,156 INFO root: Instance #0 started.
2013-01-07 22:38:06,158 INFO root: Started with pids: 3702, 3703
2013-01-07 22:38:06,165 INFO Intance #0:buffer: Initiated.
2013-01-07 22:38:06,168 INFO Intance #0:udpserver: started and listening on port 8649
2013-01-07 22:38:06,170 INFO Intance #0:ganglia: Initiated.
2013-01-07 22:38:06,171 INFO Intance #0:graphite: Initiated.
2013-01-07 22:38:06,172 INFO Intance #0:stdout: Initiated.
2013-01-07 22:38:06,174 INFO Intance #0:buffer: Started.
2013-01-07 22:38:06,174 INFO Intance #0:stdout: Started.
2013-01-07 22:38:06,175 INFO Intance #0:ganglia: Started.
2013-01-07 22:38:06,175 INFO Intance #0:graphite: Started.
0 - systems.hadoop-001.jvm.JobTracker.metrics.gcCount 159 1357598286.52
1 - systems.hadoop-001.jvm.JobTracker.metrics.gcTimeMillis 481 1357598286.52
2 - systems.hadoop-001.jvm.JobTracker.metrics.logError 0 1357598286.52
3 - systems.hadoop-001.jvm.JobTracker.metrics.logFatal 0 1357598286.52
4 - systems.hadoop-001.jvm.JobTracker.metrics.logInfo 57 1357598286.52
5 - systems.hadoop-001.jvm.JobTracker.metrics.logWarn 1 1357598286.52
6 - systems.hadoop-001.jvm.JobTracker.metrics.maxMemoryM 3866.6875 1357598286.52
7 - systems.hadoop-001.jvm.JobTracker.metrics.memHeapCommittedM 15.125 1357598286.52
8 - systems.hadoop-001.jvm.JobTracker.metrics.memHeapUsedM 7.0045853 1357598286.52
9 - systems.hadoop-001.jvm.JobTracker.metrics.memNonHeapCommittedM 23.1875 1357598286.52
10 - systems.hadoop-001.jvm.JobTracker.metrics.memNonHeapUsedM 19.089851 1357598286.52
11 - systems.hadoop-001.jvm.JobTracker.metrics.threadsBlocked 0 1357598286.52
12 - systems.hadoop-001.jvm.JobTracker.metrics.threadsNew 0 1357598286.52
... snip ...
A standalone instance
We can now start to write the metrics into Graphite. For this we require a bootstrap file which actually writes the data into Graphite:
[vagrant@metricfactory-001 ~]$ metricfactory debug --config /home/vagrant/experiments/metricfactory/ganglia2graphite/ganglia2graphite.json
Multiple instances
MetricFactory is build using the Wishbone library, which on its turn uses Gevent with green threads on top of a libevent loop. Something to keep in mind when working with greenthreads on a libevent loop is that they are great to deal with IO bound processing but not with CPU bound processing. Because of that (cutting corners here) our whole setup runs inside 1 process which doesn't take advantage of a multiple CPU architecture. This can become problematic because every time we're doing a CPU intensive task, the libevent loop stops, something we want to avoid as much as possible.
A WishBone based setup can be started with the --instances parameter, which basically starts a number of identical processes thus taking advantage of a multiple CPU architecture. In our case however we can not take advantage of this since we require an UDP listener in our setup hence we can't have multiple instances bind to that port at the same time. So let's get creative and split the setup into 2 parts:
A decoder with multiple instances
This setup creates 5 parallel instances. Each instance accepts input from its own Unix domain socket.
[vagrant@metricfactory-001 ~]$ metricfactory debug --config /home/vagrant/experiments/metricfactory/ganglia2graphite/uds-ganglia-graphite.json --instances 5 --pid /tmp/uds-ganglia-graphite.pid
A receiver
Accepts all the data on UDP and distributes that evenly over multiple decoders each listening on a domain socket.
[vagrant@metricfactory-001 ~]$ metricfactory debug --config /home/vagrant/experiments/metricfactory/ganglia2graphite/loadbalance-ganglia.json --pid /tmp/loadbalance-ganglia.pid
`The UDSclient module`_ can be initiated with "pool" set to "True".When enabled the defined path will be considered a directory containing one or more Unix domain sockets. The client "round robins" over all domain sockets found in that directory. Worth to mention is the buffer module, which buffers the Graphite data and when full submits the batch.
Conclusion
Using this setup we can accept Ganglia metrics over UDP from Hadoop, convert using multiple parallel processes the metrics to Graphite format in and submit the converted metrics in batches to Graphite. I'm planning to add more functionality to MetricFactory. Currently it can tackle mod_gearman and Ganglia data. Using the examples in this article you should be able to setup your own MetricFactory based setups relatively easy. If you require support you can submit a message to the MetricFactory mailing list.
