This article is superseded
Read Testing Graphite with MetricFactory revisited instead.
Graphite is great. Not only because it's a great piece of software but also because of the community around it which brings forth all kinds of metrics goodness. Although it's pretty straightforward to get Graphite up and running on one node, it gets a bit more complex to get it up and running in a clustered/sharded/federated mode. I found Jeff Forcier's Clustering Graphite and Richard Crowley's Federated Graphite to be very helpful. Once you have your clustered Graphite setup up and running you might want to test its behavior and get acquainted with its different settings and modules before going to production. That's where Metricfactory might help you out.
Metricfactory is a modular framework based on Wishbone aimed to quickly assemble servers which process metrics in one way or the other. So why not use it to generate random metrics and write them to Graphite in a controlled way? With this article I would like to take you through a couple of use cases.
Installation
Installing metricfactory is a matter of checking out the project from Git and running the installer. All dependencies should be downloaded automatically.
$ git clone https://github.com/smetj/metricfactory
$ cd metricfactory
$ sudo python setup.py install
We will also require some extra Wishbone modules:
$ sudo easy_install wb_tippingbucket
$ sudo easy_install wb_tcpclient
One or more of following packages might be required to successfully finish the install:
gcc, gcc-c++, make, python-devel, Cython
Once installed you can execute following command:
$ metricfactory list
That should return a list of all available modules. You should see at least TCPClient, TippingBucket, Hammer and Graphite.
Bootstrap
Starting Metricfactory requires a bootstrap file. A bootstrap file is a JSON formatted file containing the configuration of which modules to initiate and which path events will follow through these module instances.
A base bootstrap file you can found here. We will be adapting it to suit our needs. Going through the content it should give you an idea what the possibilities are.
Scenario 1: Submit unbuffered unique metrics to carbon-relay.
Let's say we have 1 carbon-relay instance running which forwards our metrics to 1 or more carbon instance. We want to verify whether all our metrics actually arrive. Each metric will be submitted as a separate TCP connection. This is quite inefficient, we should bundle metrics and submit them in bulk but for the sake of testing we'll do so.
{
  "metrics": {
    "enable": true,
    "group": "wishbone.metrics",
    "interval": 60,
    "module": "Log",
    "variables": {
    }
  },
  "bootstrap": {
    "hammer": {
      "group": "metricfactory.test",
      "module": "Hammer",
      "variables": {
        "mode":"sequential",
        "total":0,
        "sleep":0,
        "host":100,
        "metric":100,
        "value":10000000
      }
    },
    "encodegraphite": {
      "group": "metricfactory.encoder",
      "module": "Graphite",
      "variables": {
        "prefix":"hammer"
      }
    },
    "buffer": {
      "group": "wishbone.module",
      "module": "TippingBucket",
      "variables": {
        "events": 100,
        "age": 10
      }
    },
    "tcpout": {
      "group": "wishbone.iomodule",
      "module": "TCPClient",
      "variables": {
        "pool": ["graphite-001:2013"]
      }
    }
  },
  "routingtable": {
    "hammer.inbox": [ "encodegraphite.inbox" ],
    "encodegraphite.outbox": [ "tcpout.inbox" ]
  }
}
The hammer module (line 11) is the module which actually generates the metrics. We initialize the module in sequential mode (line 15). That means each individual metric is unique in terms of hostname.metricname. The amount of metrics to generate is determined by the host (line 18) and metric (line 19) variables. This means we're generating 100 unique metrics for 100 different nodes resulting into a total of 10000 metrics.
The routing table (line 46) tells us events are traveling through the modules in following order: hammer -> encodegraphite -> tcpout. The tcpout module (line 38) submits the metrics over TCP to the destination defined with the pool variable (line 42).
The buffer module (line 30) is initialized but not included in our routing table. That means it's not processing any metrics for the moment. We will come back to that in one of the following scenarios.
Start a metricfactory in the foreground using following command:
$ metricfactory debug --config hammer.json
You can stop metricfactory by pressing CTRL+C.
With this particular setup metricfactory will create 1 TCP connection per metric. So it might take a while until all metrics are actually submitted. Depending on the available resources your mileage may vary.
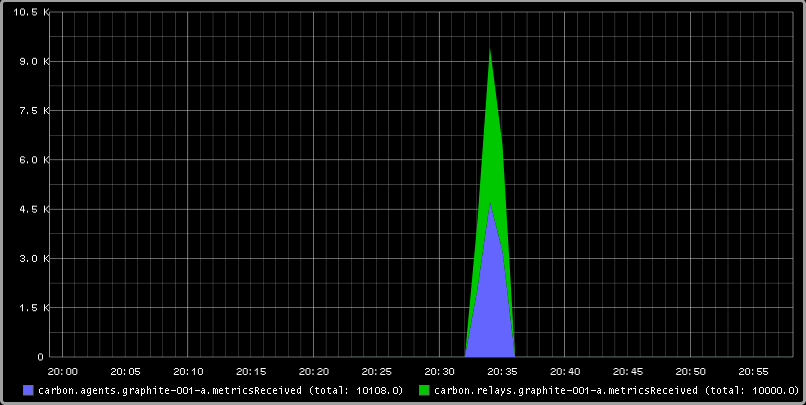
When reviewing the self generated Graphite metrics we can see we actually have received 10000 metrics.
When you have more than one carbon-relay server you can extend the pool variable (line 42) accordingly.
Scenario 2: Submit buffered unique metrics to carbon-relay.
You might want to limit the number of connections by grouping metrics and submit them in bulk to carbon-relay. We have already initialized the buffer module (line 30). The only thing left compared to our previous scenario is to include the buffer module in our routingtable section (line 48-49).
{
  "metrics": {
    "enable": true,
    "group": "wishbone.metrics",
    "interval": 60,
    "module": "Log",
    "variables": {
    }
  },
  "bootstrap": {
    "hammer": {
      "group": "metricfactory.test",
      "module": "Hammer",
      "variables": {
        "mode":"sequential",
        "total":0,
        "sleep":0,
        "host":100,
        "metric":100,
        "value":10000000
      }
    },
    "encodegraphite": {
      "group": "metricfactory.encoder",
      "module": "Graphite",
      "variables": {
        "prefix":"hammer"
      }
    },
    "buffer": {
      "group": "wishbone.module",
      "module": "TippingBucket",
      "variables": {
        "events": 100,
        "age": 10
      }
    },
    "tcpout": {
      "group": "wishbone.iomodule",
      "module": "TCPClient",
      "variables": {
        "pool": ["graphite-001:2013"]
      }
    }
  },
  "routingtable": {
    "hammer.inbox": [ "encodegraphite.inbox" ],
    "encodegraphite.outbox": [ "buffer.inbox" ],
    "buffer.outbox": [ "tcpout.inbox" ]
  }
}
The events variable (line 34) makes the buffer flush when 100 events are available. The age variable (line 35) make the buffer flush when the last added metric added is X seconds old. With this scenario we would only require 10 TCP connections compared to 10000 to submit the same number of metrics.
Scenario 3: Generate a constant stream of random metrics.
To generate a continuous stream of random metrics we can set the mode variable (line 15) to random. This gives a different meaning to the host (line 18) and metric (line 19) variables. They now become for each metric the maximum value of a random integer to choose from starting from 0. Hostnames will have the format host_1234 and metrics metric_1234. Depending upon your specific needs, you might want to choose a higher value to avoid duplicate values being generated.
{
  "metrics": {
    "enable": true,
    "group": "wishbone.metrics",
    "interval": 60,
    "module": "Log",
    "variables": {
    }
  },
  "bootstrap": {
    "hammer": {
      "group": "metricfactory.test",
      "module": "Hammer",
      "variables": {
        "mode":"random",
        "total":0,
        "sleep":0,
        "host":1000,
        "metric":1000,
        "value":10000000
      }
    },
    "encodegraphite": {
      "group": "metricfactory.encoder",
      "module": "Graphite",
      "variables": {
        "prefix":"hammer"
      }
    },
    "buffer": {
      "group": "wishbone.module",
      "module": "TippingBucket",
      "variables": {
        "events": 100,
        "age": 10
      }
    },
    "tcpout": {
      "group": "wishbone.iomodule",
      "module": "TCPClient",
      "variables": {
        "pool": ["graphite-001:2013"]
      }
    }
  },
  "routingtable": {
    "hammer.inbox": [ "encodegraphite.inbox" ],
    "encodegraphite.outbox": [ "buffer.inbox" ],
    "buffer.outbox": [ "tcpout.inbox" ]
  }
}
The sleep variable (line 17) determines how much time to wait between generating each metric. That might be useful when you want to limit CPU usage or control the interval between metrics. A value of 0 means Metricfactory will drain your CPU trying to produce as much as possible. Setting a value of 1 means one metric will be produced every second. When you notice Metricfactory gradually consumes all memory available that means data is produced at a higher rate than you can submit to Graphite. In that case you might want to raise the events variable (line 34) which allows you to submit larger chunks of data per connection.
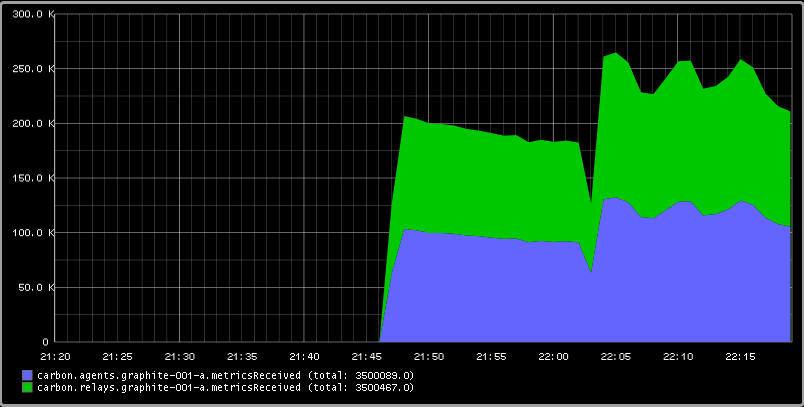
Depending on your settings Metricfactory can generate a significant amount of metrics. You could even raise that by starting multiple parallel processes:
$ metricfactory debug --config hammer.json --instances 4
This will start 4 parallel processes each executing exactly the same.
Conclusion
Generating a predictable number of metrics can be practical to verify whether your Graphite setup behaves as expected under different scenarios. It becomes more meaningful if you have a more complex environment with a number of relays, sharding and duplication policies. By generating large batches of continuous data with different sizing it's possible to get an idea about the throughput of your Graphite setup.